
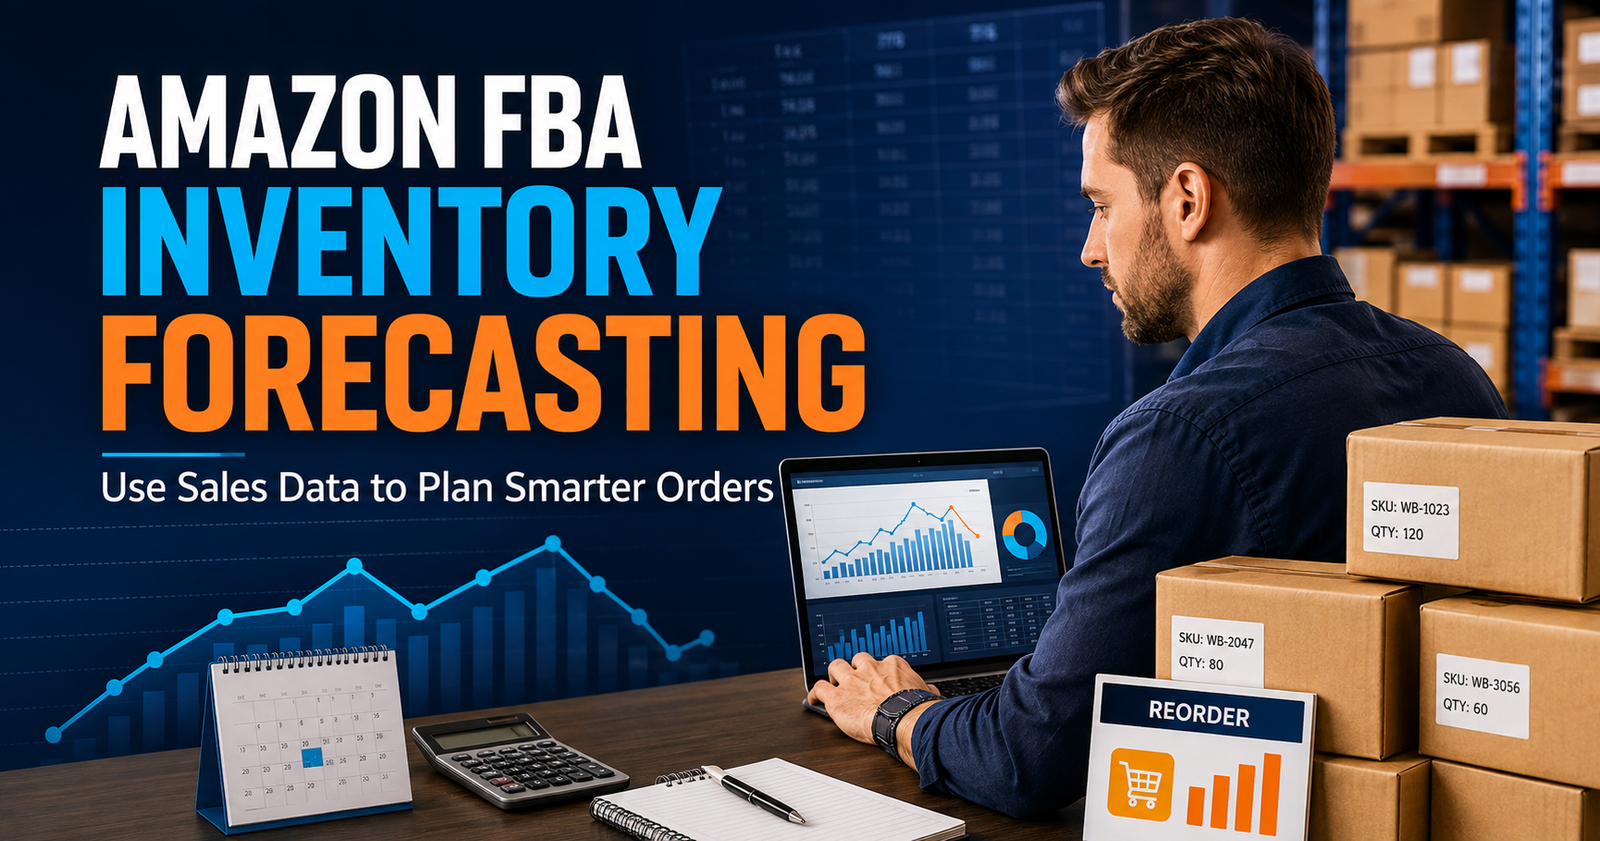
Inventory decisions can make or break an Amazon FBA business. Order too little, and a fast-selling product may go out of stock before your next shipment arrives. Order too much, and valuable capital can become tied up in products that take months to sell.
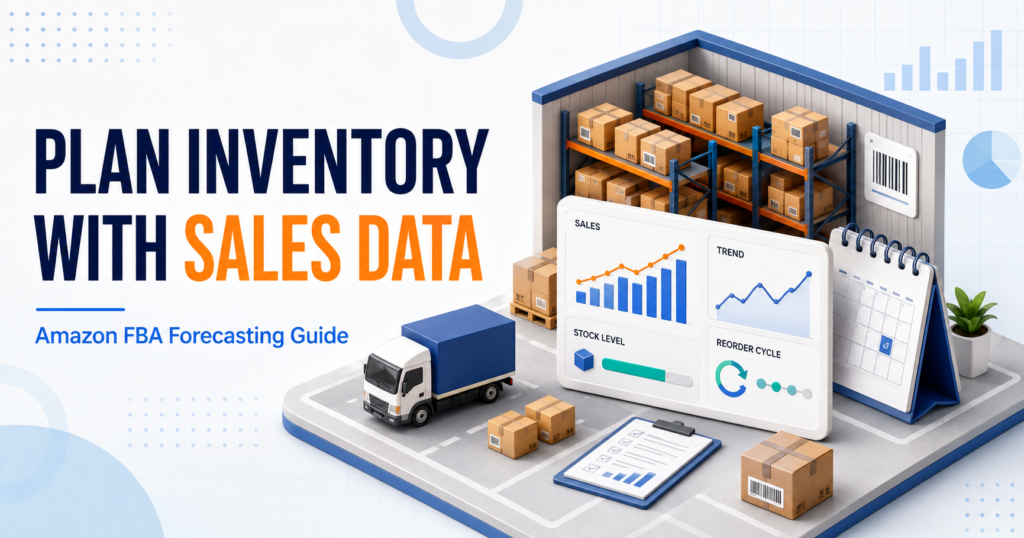
The answer is not to guess which products will perform well. It is to build a simple Amazon FBA inventory forecasting process based on actual sales data, supplier lead times, seasonality, and realistic demand.
Whether you are placing your first wholesale order or managing several established ASINs, a reliable forecast can help you decide when to reorder, how many units to buy, and how much safety stock to maintain.
Quick Answer
Amazon FBA inventory forecasting is the process of estimating future product demand using historical sales, current sales velocity, supplier lead time, seasonality, promotions, and available inventory.
A basic reorder point can be calculated with this formula:
Reorder Point = Expected Sales During Lead Time + Safety Stock
For example, if a product sells 10 units per day, takes 30 days to replenish, and requires 100 units of safety stock, the reorder point would be:
(10 × 30) + 100 = 400 units
This means you should consider placing your next order when your usable and confirmed inbound inventory falls to approximately 400 units.
What Is Amazon FBA Inventory Forecasting?
Amazon FBA inventory forecasting means using past and present sales information to estimate how many units customers are likely to purchase during a future period.
A forecast does not predict demand with complete certainty. Instead, it gives you a practical purchasing range based on the information available today.
An effective forecast usually considers:
- Average daily and weekly sales
- The number of days a product was actually in stock
- Recent changes in sales velocity
- Seasonal demand patterns
- Advertising and promotional activity
- Supplier processing time
- Shipping and Amazon receiving time
- Current sellable and inbound inventory
- A safety-stock allowance
- Available purchasing capital
These factors help sellers move away from emotional buying. Instead of ordering a large quantity because a product “looks promising,” you can calculate whether the expected demand supports the investment.
Sales Velocity Is the Starting Point
Sales velocity shows how quickly a product is selling over a specific period. A simple calculation is:
Average Daily Sales = Units Sold ÷ In-Stock Selling Days
If you sold 360 units during 30 days in which the product was available, your average daily sales would be 12 units.
Use in-stock days rather than total calendar days. If the product was unavailable for ten days, including those days would reduce the average and create an inaccurate forecast.
Why Inventory Forecasting Matters for Amazon FBA Sellers
Amazon FBA sellers operate between two costly risks: having too much inventory and having too little.
It Helps Reduce Stockout Risk
When an item goes out of stock, you may lose sales while waiting for a restock. A long interruption can also affect advertising efficiency and the product’s recent sales momentum.
If high-demand periods are a concern, our guide on preventing Amazon FBA stockouts during high-demand periods explains how lead-time planning, safety stock, and early supplier communication work together.
It Protects Working Capital
Every unsold unit represents money that cannot currently be used for another order, operating costs, advertising, or a stronger opportunity. Forecasting helps you buy according to expected demand instead of filling an order with more inventory than the business can reasonably sell.
This is especially important for beginners. Before building a forecast, new sellers may also want to review how much wholesale inventory a new Amazon seller should buy.
It Supports More Consistent Purchasing
A documented forecast makes supplier orders easier to plan. You know approximately when inventory will reach its reorder point, so you can request updated pricing, confirm availability, arrange payment, and prepare shipping before the situation becomes urgent.
It Improves Product-Level Decisions
Forecasting should be performed at the ASIN or SKU level. Two products in the same category may have completely different demand patterns, margins, competition, and replenishment schedules.
Product-level analysis helps you identify:
- Items that deserve a larger reorder
- Slow-moving products that need a smaller order
- Seasonal items that require early planning
- Products whose recent sales growth may justify additional stock
- ASINs that should be paused or reviewed before more capital is committed
Step-by-Step Amazon FBA Inventory Forecasting Guide
Step 1: Collect Reliable Sales Data
Begin with your Amazon sales and inventory reports. Depending on the marketplace and account tools available, gather data covering at least the recent 30, 60, and 90-day periods.
For each product, record:
- Units sold
- Number of in-stock days
- Average daily sales
- Current sellable inventory
- Confirmed inbound inventory
- Supplier lead time
- Shipping and receiving time
- Planned promotions or price changes
- Known seasonal events
Looking at more than one period gives you a clearer view. A 30-day average reflects recent demand, while a 90-day average helps prevent a temporary sales spike from controlling the entire forecast.
Step 2: Clean the Data Before Using It
Raw sales numbers can be misleading. Check whether sales were influenced by:
- Stockouts or listing suppression
- A temporary price reduction
- Increased advertising
- A coupon or promotion
- A competitor going out of stock
- Unusually high returns
- Seasonal demand
- A major change in Buy Box performance
Suppose a product sold 20 units per day during a short promotion but usually sells eight. Forecasting future orders at 20 units per day could result in excess stock once the promotion ends.
The goal is not to remove every unusual event. It is to understand why the numbers changed and decide whether the change is likely to continue.
Step 3: Calculate Average Daily Sales
Use the following formula:
Average Daily Sales = Units Sold ÷ In-Stock Days
For example:
- Units sold: 360
- In-stock days: 30
- Average daily sales: 12 units
You can also calculate separate averages for 30, 60, and 90 days.
If recent demand is increasing steadily, you may give more importance to the 30-day figure. If sales are irregular, a longer average may provide a safer baseline.
Step 4: Determine the Complete Lead Time
Lead time is not limited to the number of days your distributor takes to ship. It should cover the entire replenishment process, including:
- Preparing and approving the purchase order
- Payment processing
- Supplier handling time
- Domestic or international transit
- Prep or labeling, when applicable
- Delivery to Amazon
- Amazon receiving and inventory availability
- Extra time for possible delays
If your supplier takes 10 days to prepare the order, shipping takes seven days, and Amazon receiving takes another 11 days, your estimated total lead time is 28 days.
Use realistic lead times based on previous orders. Planning with the fastest shipment you have ever received can leave your business exposed if the next shipment takes longer.
Step 5: Add Safety Stock
Safety stock is additional inventory held to cover unexpected demand or replenishment delays.
A beginner-friendly method is:
Safety Stock = Average Daily Sales × Buffer Days
If a product sells 12 units per day and you choose a 14-day buffer:
12 × 14 = 168 units of safety stock
The number of buffer days should reflect the product’s stability and supply risk. A consistent product from a dependable domestic source may need a smaller buffer than a highly seasonal item with an unpredictable lead time.
Avoid applying the same buffer to every SKU. Products with different demand patterns and supply conditions should have different safety-stock levels.
Step 6: Calculate the Reorder Point
Your reorder point tells you when to begin the replenishment process.
Use this formula:
Reorder Point = Lead-Time Demand + Safety Stock
If a product sells 12 units per day, has a 28-day lead time, and requires 168 units of safety stock:
- Lead-time demand: 12 × 28 = 336 units
- Safety stock: 168 units
- Reorder point: 336 + 168 = 504 units
When the product’s usable inventory position approaches 504 units, it may be time to place the next order.
Do not rely only on the inventory physically available at Amazon. Review sellable units, confirmed inbound stock, pending orders, reserved quantities, and any warehouse stock that can realistically be sent to FBA.
Step 7: Calculate the Order Quantity
Your reorder point tells you when to order. Your target stock coverage helps determine how much to order.
A simple target-stock formula is:
Target Inventory = Average Daily Sales × Desired Days of Coverage
Assume you want 60 days of coverage:
12 units × 60 days = 720 units
If you currently have 260 usable units and 120 confirmed inbound units:
720 − (260 + 120) = 340 units
Your preliminary order quantity would be 340 units.
Before finalizing the order, compare this figure with:
- Distributor minimum order quantities
- Case-pack requirements
- Available cash
- Expected profit after Amazon fees and other costs
- Product expiration dates, if relevant
- Storage capacity
- Listing and category eligibility
- Current competition and pricing
Step 8: Adjust for Seasonality and Business Changes
Historical averages should not be used blindly. Increase or decrease the forecast when you have reasonable evidence that future conditions will differ.
Possible adjustments include:
- Holiday demand
- Back-to-school periods
- Weather-related demand
- Planned advertising campaigns
- Price increases or reductions
- New competitors entering the listing
- Loss or recovery of Buy Box share
- Product trends
- Changes in supplier pricing
- Listing improvements
Keep base demand and promotional demand separate. If advertising is expected to generate more sales, create a base forecast and an adjusted forecast rather than treating the higher number as certain.
Step 9: Review the Forecast Regularly
Inventory forecasting is an ongoing process. Fast-moving products may need weekly reviews, while slower or more stable products may be reviewed every two to four weeks.
A useful inventory dashboard can include:
- Current daily sales rate
- Days of stock remaining
- Reorder point
- Suggested reorder date
- Confirmed inbound quantity
- Supplier lead time
- Safety-stock level
- Estimated stockout date
- Next purchase-order status
Update the forecast whenever demand, pricing, supplier availability, or shipment timing changes.
Common Inventory Forecasting Mistakes to Avoid
Using Revenue Instead of Unit Sales
Revenue can change because of pricing. Inventory forecasting should primarily be based on the number of units sold.
Counting Out-of-Stock Days as Normal Selling Days
This lowers average daily sales and can cause you to reorder too little.
Assuming a Sales Spike Will Continue
A temporary promotion, competitor stockout, or advertising increase can create a short-lived jump. Investigate the cause before increasing the purchase quantity.
Ignoring Amazon Receiving Time
A shipment is not available for sale immediately after leaving the distributor. Include prep, transit, delivery, and receiving time in the forecast.
Treating All Products the Same
Each ASIN has its own demand, margin, lead time, competition, and risk. Use SKU-level forecasts instead of one percentage increase across the entire catalog.
Ordering Only When Inventory Looks Low
By the time inventory appears low, it may already be too late to replenish before a stockout. Reorder points create an earlier and more objective trigger.
Forgetting Cash-Flow Limits
A forecast may recommend a large order, but the order must still fit your working-capital plan. Prioritize products based on demand consistency, net profitability, supply reliability, and overall risk.
How a Verified Wholesale Distributor Can Help
Accurate forecasting works best when the supply side is also dependable. A wholesale distributor can support better inventory planning by providing clear case quantities, current availability, expected processing times, pricing, and appropriate business documentation.
Working with a reliable source may help sellers:
- Confirm whether sufficient stock is available
- Understand minimum order and case-pack requirements
- Estimate more realistic replenishment times
- Maintain organized wholesale invoices
- Keep better sourcing and authenticity records
- Plan category-level purchases more efficiently
- Reduce last-minute sourcing decisions
Wholesale invoices and sourcing records may help support approval or authenticity requests depending on Amazon’s requirements. However, requirements may vary by category, brand, marketplace, and individual account. No distributor can guarantee Amazon approval or ungating.
You can learn more about the company’s sourcing approach on the About Nations Distributor page. Sellers can also visit Nations Distributor to review available wholesale product categories before preparing their next inventory plan.
Final Thoughts
Amazon FBA inventory forecasting does not need to begin with complicated software. A practical spreadsheet containing sales velocity, lead time, safety stock, current inventory, and reorder points can already improve purchasing decisions.
Start with clean sales data. Calculate demand using the days the product was actually available. Include the entire replenishment timeline, add a sensible safety-stock buffer, and review the forecast regularly. Most importantly, treat each ASIN as a separate investment rather than applying the same order quantity to every product.
If you are preparing your next wholesale order, explore the available product categories and apply for a wholesale account. If you need information about product availability, documentation, case quantities, or the ordering process, contact the distributor before finalizing your forecast.
Frequently Asked Questions
1. How do I forecast inventory for Amazon FBA?
Calculate average daily sales using in-stock selling days, multiply that figure by the complete supplier lead time, and add safety stock. Adjust the result for seasonality, promotions, pricing changes, and confirmed inbound inventory.
2. What is a good forecast period for an Amazon seller?
Review 30, 60, and 90-day sales periods together. The 30-day period shows recent demand, while longer periods help identify stable patterns and prevent short-term spikes from distorting purchasing decisions.
3. How is an Amazon FBA reorder point calculated?
Use this formula: Reorder Point = Average Daily Sales × Total Lead-Time Days + Safety Stock. Reorder when usable and confirmed inventory approaches this level.
4. How much safety stock should an Amazon FBA seller keep?
There is no single amount for every product. Choose buffer days based on demand stability, supplier reliability, shipment time, seasonality, and the financial cost of holding extra units.
5. Can wholesale invoices help with Amazon approval requests?
Valid wholesale invoices and organized sourcing records may help support approval or authenticity requests, depending on Amazon’s requirements. Acceptance is determined by Amazon, and requirements may vary by category, brand, marketplace, and seller account.